
Monitoring
Kosatka keeps no graphs or alerts of its own. It writes what a monitoring system needs in open formats - the log on standard output, the metrics in the Prometheus text format - and a collector on the server sends them to where you look at them: Grafana (Loki for the log, Prometheus or Mimir for the metrics), Elasticsearch, VictoriaMetrics and the like.
Turning it on
Section titled “Turning it on”In the site’s config (or the variables in parentheses):
log: format: json # LOG_FORMAT: text (the default) or json requests: true # LOG_REQUESTS: a line for every requestmetrics: listen: 127.0.0.1:9101 # METRICS_LISTEN: unset - no metricsRestart the site, then check:
curl -s http://127.0.0.1:9101/metrics | headjournalctl -u kosatka@example -n 5 -o catSeveral sites on one server: each its own metrics port (9101,
9102…; app sites add takes it as -metrics-port). The metrics server answers GET /metrics only; keep it on
the loopback address, or behind a firewall when the collector runs on
another machine.
The log
Section titled “The log”With format: json each line is a JSON object; the request lines
(requests: true) look like this:
{"time":"2026-11-09T15:04:05.123Z","level":"INFO","msg":"request","method":"GET","path":"/blog/hello","route":"/","status":200,"duration_ms":12.4,"bytes":18234,"user_id":3,"request_id":"9f2c0e1b7a4d5e61"}| Field | |
|---|---|
time, level, msg |
every line: when, DEBUG/INFO/WARN/ERROR, what happened |
error |
the error, on the lines about one |
request_id |
the request the line is about (below) |
method, path, route, status, duration_ms, bytes |
a request line: the path without the query string, the route that answered, the status code, the time taken, the bytes sent |
user_id |
a request line: the signed-in user, none for a guest |
The visitors’ addresses aren’t in the request lines (the web server’s
access log has them), nor the query strings. A path holding a secret - a
{token} in its route: a password reset, a preview, an unsubscribe
link - is logged as its route (/preview/{token}). Still, keep the
site’s log where you would keep the web server’s, and mind how long a
hosted service keeps it.
Request ids
Section titled “Request ids”Every answer has an X-Request-Id header: the id of the request in
the site’s log. When the request comes through a trusted proxy
(trusted_proxies, the
loopback address by default) with an X-Request-Id of its own, the site
keeps it, so the web server’s log and the site’s share the id. With
nginx:
proxy_set_header X-Request-Id $request_id;The request lines and the error lines written while answering a page (content that failed to load, a panic) carry the id.
The metrics
Section titled “The metrics”| Metric | Type | |
|---|---|---|
kosatka_http_requests_total{method, route, code} |
counter | the requests answered |
kosatka_http_request_duration_seconds{route} |
histogram | the time to answer, from 5 ms to 5 s |
kosatka_http_requests_in_flight |
gauge | the requests being answered |
kosatka_db_open_connections, kosatka_db_in_use_connections, kosatka_db_idle_connections, kosatka_db_max_open_connections |
gauge | the database connection pool |
kosatka_db_wait_count_total, kosatka_db_wait_duration_seconds_total |
counter | the times a query waited for a free connection, and how long |
kosatka_db_up |
gauge | 1 while the database answers the site’s pings, 0 while it doesn’t |
kosatka_build_info{version, commit} |
gauge | the engine’s release the binary was built from |
go_goroutines, go_memstats_heap_alloc_bytes, go_gc_cycles_total, process_start_time_seconds… |
the Go runtime, under the usual names |
route is the address pattern that answered (/node/{id},
/admin/content, / for content at its own path), so the number of
series stays small; none - no route answered (a redirect, the
maintenance page, an address nothing matches). /healthz isn’t counted.
Queries to start a dashboard with (PromQL):
# Requests a second, by status codesum by (code) (rate(kosatka_http_requests_total[5m]))
# The share of server errorssum(rate(kosatka_http_requests_total{code=~"5.."}[5m]))  / sum(rate(kosatka_http_requests_total[5m]))
# The 95th percentile of the answer time, by routehistogram_quantile(0.95,  sum by (le, route) (rate(kosatka_http_request_duration_seconds_bucket[5m])))
Grafana with Alloy
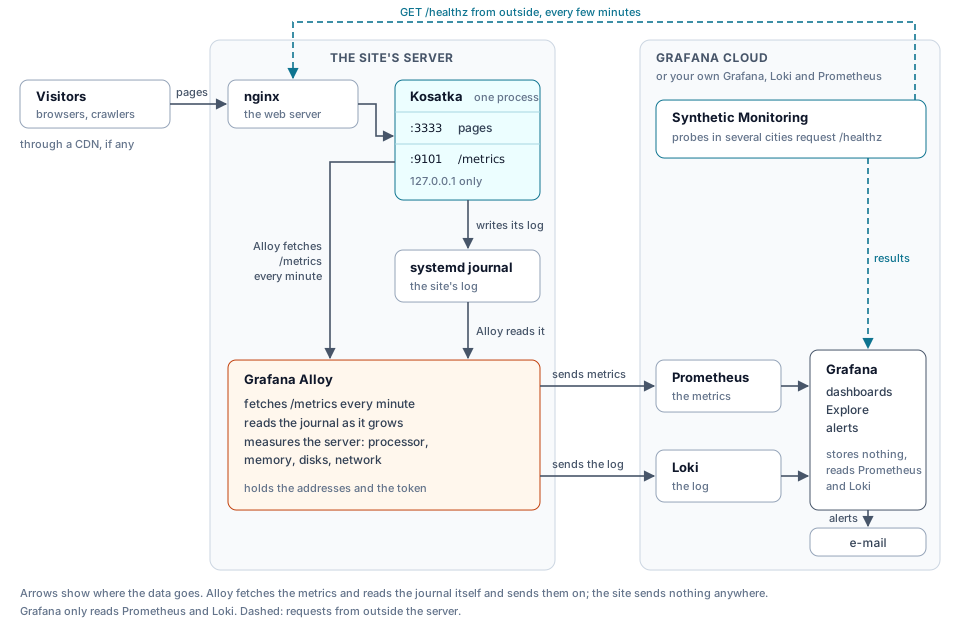
Section titled “Grafana with Alloy”Grafana Alloy runs on the site’s server next to the site. It reads the site’s metrics and journal and the server’s own figures (processor, memory, disks, network) and sends them on: the metrics to Prometheus, the log to Loki, which Grafana reads. In Grafana Cloud all three are run for you; the steps below set up Grafana Cloud’s free plan, then your own needs only other addresses. The diagram at the top of the page shows who fetches and who sends.
1. A Grafana Cloud stack
Section titled “1. A Grafana Cloud stack”Sign up at grafana.com. A stack - your Grafana
at https://<stack>.grafana.net with its Prometheus and Loki - is
created with the account (else Add Stack in the Cloud Portal); pick a
region near the server: the data is kept there.
In the Cloud Portal (grafana.com, My Account), open the stack:
- the Prometheus card, Details: the Remote Write Endpoint
(
https://prometheus-….grafana.net/api/prom/push) and the Username / Instance ID (a number); - the Loki card, Details: the URL (
https://logs-….grafana.net; Alloy sends to it with/loki/api/v1/pushadded) and the User (a number).
These aren’t secret.
2. A token
Section titled “2. A token”In the Cloud Portal, Security, Access Policies, New access policy:
the stack as its realm, the Write scope of metrics and of logs,
nothing else. Create it, then Add token on it. The token (glc_…) is
shown once: keep it where you keep passwords, never in a chat or a
repository.
Grafana’s Connections page offers a Linux Server wizard with a command that installs Alloy; it brings a configuration of its own and puts the token on the command line. The steps below don’t use it.
3. Install Alloy
Section titled “3. Install Alloy”On Debian and Ubuntu, from Grafana’s APT repository. Where the server can’t reach the repository, install the same package from Alloy’s releases, checked against their checksums (no repository then: a new version is installed the same way):
v=1.21.3 # the latest releasebase=https://github.com/grafana/alloy/releases/download/v$vcurl -fsSLO $base/alloy-$v-1.amd64.debcurl -fsSLO $base/SHA256SUMSgrep " alloy-$v-1.amd64.deb$" SHA256SUMS | sha256sum -c -sudo apt-get install ./alloy-$v-1.amd64.debThe package creates the alloy user, already in the systemd-journal
group (it reads the journal; check with id alloy), and leaves the
service stopped.
4. The addresses and the token
Section titled “4. The addresses and the token”Alloy’s service reads /etc/default/alloy. Add the addresses from step 1
at its end and let root alone read the file:
sudo tee -a /etc/default/alloy > /dev/null <<'END'
# Grafana Cloud: where config.alloy sends to.PROMETHEUS_URL="https://prometheus-….grafana.net/api/prom/push"PROMETHEUS_USER="123456"LOKI_URL="https://logs-….grafana.net/loki/api/v1/push"LOKI_USER="654321"ENDsudo chmod 600 /etc/default/alloy
Then the token, typed rather than pasted into a command (it stays out of the shell’s history and off the screen) - from your computer:
bash -c 'read -rsp "Token: " T; echo; printf "GRAFANA_CLOUD_TOKEN=\"%s\"\n" "$T" | ssh root@<server> "cat >> /etc/default/alloy"'5. The configuration
Section titled “5. The configuration”Write /etc/alloy/config.alloy - here for one site, example (the
unit kosatka@example.service, its metrics on port 9101). A second
site: another targets entry and another loki.source.journal. The same
file is in the repository,
deploy/monitoring/config.alloy.
logging {  level = "warn"}
// The server: processor, memory, disks, network.prometheus.exporter.unix "host" { }
prometheus.scrape "host" {  targets         = prometheus.exporter.unix.host.targets  scrape_interval = "60s"  forward_to      = [prometheus.remote_write.grafana.receiver]}
// The sites' metrics (metrics.listen in their configs).prometheus.scrape "kosatka" {  targets         = [{"__address__" = "127.0.0.1:9101", "site" = "example"}]  scrape_interval = "60s"  forward_to      = [prometheus.remote_write.grafana.receiver]}
prometheus.remote_write "grafana" {  endpoint {    url = sys.env("PROMETHEUS_URL")    basic_auth {      username = sys.env("PROMETHEUS_USER")      password = sys.env("GRAFANA_CLOUD_TOKEN")    }  }}
// The sites' log, from the systemd journal: one source a unit.loki.source.journal "example" {  matches    = "_SYSTEMD_UNIT=kosatka@example.service"  labels     = {job = "kosatka", site = "example"}  forward_to = [loki.process.kosatka.receiver]}
// The level as a label, from text lines (level=INFO) and JSON ones// ("level":"INFO"), to pick the errors out quickly.loki.process "kosatka" {  stage.regex {    expression = `(?:level=|"level":")(?P<level>[A-Z]+)`  }  stage.labels {    values = {level = ""}  }  forward_to = [loki.write.grafana.receiver]}
loki.write "grafana" {  endpoint {    url = sys.env("LOKI_URL")    basic_auth {      username = sys.env("LOKI_USER")      password = sys.env("GRAFANA_CLOUD_TOKEN")    }  }}
The server’s metrics come labelled job="integrations/unix" and
instance - the server’s host name; the sites’ log job="kosatka",
site and level.
6. Check and start
Section titled “6. Check and start”# the configuration, with the addresses it readssudo bash -c 'set -a; . /etc/default/alloy; alloy validate /etc/alloy/config.alloy'sudo systemctl enable --now alloyjournalctl -u alloy -n 20A minute later, on the server:
# each component "healthy"curl -s http://127.0.0.1:12345/api/v0/web/components | grep -o '"localID":"[^"]*"\|"state":"[^"]*"'# what failed to go: both 0curl -s http://127.0.0.1:12345/metrics | grep -E '^(prometheus_remote_storage_samples_failed_total|loki_write_dropped_entries_total)'Alloy’s own interface - its components and what flows between them - is
at http://127.0.0.1:12345 on the server; from your computer,
ssh -L 12345:127.0.0.1:12345 <server> and open
http://127.0.0.1:12345.
7. In Grafana
Section titled “7. In Grafana”Explore runs a query against one source: pick
grafanacloud-<stack>-prom (the metrics) or grafanacloud-<stack>-logs
(the log) at the top, switch the query editor to Code, type the query
and run it (Shift+Enter). An empty query shows nothing.
The log (LogQL):
{job="kosatka"}{job="kosatka", site="example", level=~"WARN|ERROR"}{job="kosatka"} | json | msg="request" | duration_ms > 1000{job="kosatka"} |= "9f2c0e1b7a4d5e61"The server (PromQL):
node_memory_MemAvailable_bytes{job="integrations/unix"}node_filesystem_avail_bytes{job="integrations/unix", mountpoint="/"}1 - avg(rate(node_cpu_seconds_total{job="integrations/unix", mode="idle"}[5m]))Drilldown, Logs shows the log by site and level without a query. A panel’s menu, Explore, opens its query here - a start for a query or an alert rule of your own.
8. The sites’ dashboard
Section titled “8. The sites’ dashboard”deploy/monitoring/kosatka-dashboard.json
is a dashboard for Kosatka sites. Download it and import it:
Dashboards, New, Import, Upload dashboard JSON file, Import.
It expects the labels of the configuration above: site on the sites’
metrics, job="kosatka" and site on their log.
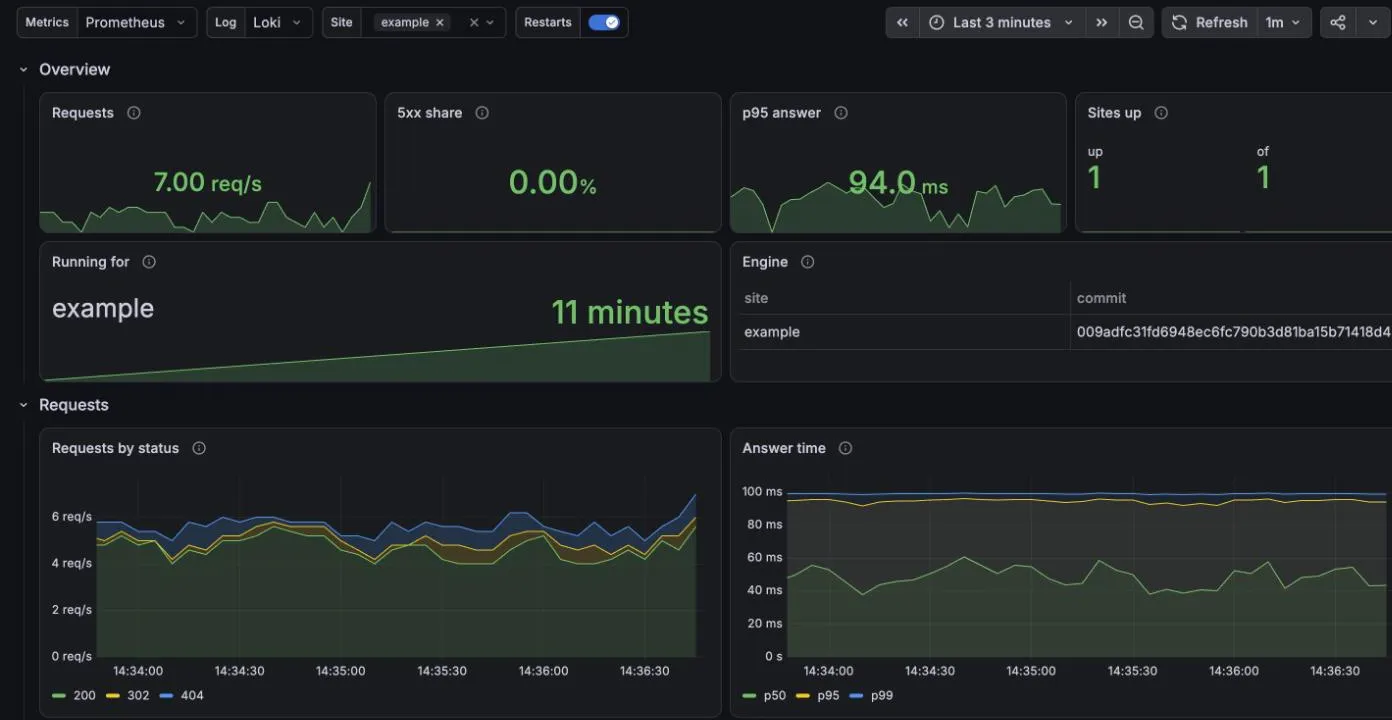
At the top: Metrics and Log - the Prometheus and Loki sources; Site - one site, several or all; Restarts - the sites’ restarts (a deploy is one) as marks on the graphs.
| Row | What it shows |
|---|---|
| Overview | requests a second, the share of server errors, the 95th percentile of the answer time, the sites up, how long each has run, the engine each runs |
| Requests | requests by status, the answer time (median, 95th and 99th percentiles), the busiest and the slowest routes, server errors by route |
| Process and database | requests in flight and goroutines, the connection pool, queries waiting for a connection, memory, garbage collection |
| Log | the log’s lines by level, the warnings and errors, the requests over a second (with log.requests) |
A route is the address pattern that answered: the slowest routes say
which part of the site is slow (/ is content at its own path), the
log’s slow requests which address.
9. The server’s dashboard
Section titled “9. The server’s dashboard”Node Exporter Full is
the usual dashboard for a Linux server’s metrics in the node_exporter
format, the one Alloy’s prometheus.exporter.unix gives. It is a
community dashboard, number 1860 in grafana.com’s catalogue of
dashboards, kept by its author at
rfmoz/grafana-dashboards.
To add it: Dashboards, New, Import, type 1860, Load, Import
(and grafanacloud-<stack>-prom if it asks for a Prometheus source).
The import saves a copy of the dashboard in your Grafana - its panels
and their queries, not data: the data comes from your Prometheus as you
look. The copy doesn’t follow the author’s new versions; importing
again updates it, over your changes (keep those in a copy of your own,
Save as).
At the top: Datasource, Job (integrations/unix with the
configuration above), Nodename and Instance (the server, when
several send their metrics), the time range and how often it refreshes.
| Row | What it shows |
|---|---|
| Quick CPU / Mem / Disk | the figures at a glance: resource pressure, the processor busy, the load per core, the memory used (without the caches), the swap used, the root filesystem used; the cores, the memory, the swap and the root filesystem’s sizes, the uptime |
| Basic CPU / Mem / Net / Disk | the processor, the memory, the network traffic and the disk space over time |
| CPU / Memory / Net / Disk, Memory Details, Processes, CPU & Scheduler, Storage, Network Traffic, Network Sockstat, Network Netstat | folded rows with the details: open one when a figure above looks wrong |
| Hardware & Time, Systemd, Node Exporter | temperatures and the clock, the services’ states, the exporter itself |
What to keep an eye on for a server running sites:
- Root FS Used: uploads, backups, database dumps and the journal grow.
- RAM Used and SWAP Used: a server without swap ends a process when the memory runs out, and a site goes down with it.
- Sys Load above 100% for long: the processor can’t keep up; a large iowait share in CPU Basic: the disk can’t.
- Network Traffic Basic: a sudden rise is often a crawler or a bot.
Empty panels are usual on a virtual server (temperatures, other hardware). The Systemd row needs the exporter’s systemd collector - then it shows whether each site’s service is running:
prometheus.exporter.unix "host" { enable_collectors = ["systemd"] systemd { unit_include = `(kosatka@.+|nginx|alloy)\.service` }}The same metric serves an alert on a site’s service stopping:
node_systemd_unit_state{name="kosatka@example.service", state="active"} == 0.
10. Checking the site from outside
Section titled “10. Checking the site from outside”Everything above comes from inside the server; when the server, its network or the web server in front of the site fails, nothing comes at all. Grafana Cloud’s Synthetic Monitoring requests the site from outside on a schedule and alerts when it doesn’t answer.
Testing & synthetics, Synthetics, Get started (once), then Create check manually, API Endpoint:
- Request: a job name (the site’s), HTTP,
GET https://<site>/healthz. - Uptime: the status
2xx, Fail if SSL is not present, and a Regexp validation of the Body,^okwith Invert ticked (a validation fails the check when the body matches; inverted, when it doesn’t). - Execution: a few probes near the site’s visitors (three in Europe, say) and how often - the form shows the executions a month it costs (three probes every 3 minutes: about 45,000).
- Alerting: Failed Checks - alert when at least 2 of 3 probe executions fail in 5 minutes (one failure alone is often a probe’s own network). The Email addresses given here make a contact point and a notification policy for this check and later ones.
Test runs the check once before saving it. A CDN in front of the site that challenges bots may stop the probes: the test shows it (a 403 instead of a 200).
Your own Grafana, Loki and Prometheus
Section titled “Your own Grafana, Loki and Prometheus”The same Alloy configuration with their addresses (and no token where
they don’t ask for one): Loki takes the log, Prometheus started with
--web.enable-remote-write-receiver (or VictoriaMetrics) takes the
metrics, and Grafana reads both - add them in Connections, Data
sources. A Prometheus can also scrape /metrics itself; the log still
needs Alloy. Grafana, Loki and Prometheus want a machine of their own
rather than a small server running the sites.
When the database is gone
Section titled “When the database is gone”The site pings its database every 5 seconds. Two failed pings in a row (the database down, its host unreachable, its connections all taken) and, until it answers again:
- every request gets a 503 at once - a page “The site is temporarily
unavailable” titled with the site’s name,
Retry-After: 30, never cached; JSON for/api/- instead of each waiting for a connection and failing with a 500 a minute later; - the background jobs and the refresh of the cached blocks wait - no error in the log every minute;
kosatka_db_upis 0 and/healthzanswers 503;- the log has one line at the start (level ERROR, “the database doesn’t answer”) and one at the end, with how long it lasted (“the database answers again”).
Nothing needs restarting: the site comes back by itself with its
database. A new connection may take db.connect_timeout seconds (10)
(Configuration); the requests already
waiting on the database when it went keep waiting up to
timeouts.database_query.
Elasticsearch
Section titled “Elasticsearch”The Elastic Agent (or Filebeat) reads the journal - the journald
input, with the message decoded as JSON - and its Prometheus
integration (or Metricbeat’s prometheus module) collects /metrics.
See Elastic’s documentation for those inputs.
What to alert on
Section titled “What to alert on”In Grafana, Alerts & IRM, Alert rules, New alert rule: a query, the condition and how long it holds, and where to send the alert (e-mail, a messenger) in Contact points. deploy/monitoring/alerts.yml holds the rules below in the Prometheus format - for a Prometheus or Mimir ruler, or to copy the queries from.
- The site not answering: a check of
https://<site>/healthzfrom outside the server (it answersokwhile the database does) - step 10. - The database not answering:
kosatka_db_upat 0 for a minute (see When the database is gone). - A site’s
/metricsnot answering: its process is down. - The share of server errors above, say, 1% for 10 minutes.
- The 95th percentile of the answer time above a second.
- Queries waiting for a database connection: the pool is too small for the load.
- A site restarting again and again: it keeps failing.
- The disk filling up (
node_filesystem_avail_bytesof the server’s metrics): uploads, backups and the journal grow.